
1 Introduction
Despite rising economic inequality and limited social mobility in contemporary societies (Chancel et al., 2025; López-Roldán & Fachelli, 2021), the belief that inequalities reflect disparities in effort and talent instead of opportunities remains remarkably widespread among citizens (Mijs, 2021). This idea refers to meritocracy, the notion that social rewards are, and should be, allocated according to individual effort and ability rather than social origins or personal connections (Bell, 1972; Young, 1958). Although the term “meritocracy” was originally coined as a critique of a future society where meritocratic principles would be taken to an extreme (Young, 1958), it has since been widely adopted as a normative ideal that justifies existing social arrangements and motivates individual striving (Mijs, 2021; Sandel, 2020). On the one hand, meritocracy can be seen as a powerful narrative that promotes social cohesion and motivates individuals to work hard and pursue their goals. On the other hand, it can also be criticized for obscuring structural inequalities and legitimizing the status quo (Hoyt et al., 2023; Tejero-Peregrina et al., 2025). Therefore, the persistence of meritocratic beliefs could have important implications for how people understand and respond to inequality, as well as for the legitimacy of social institutions (Madeira et al., 2019; Sandel, 2020).
The idea of meritocracy is particularly salient in school settings, where it operates not only as a cultural ideal but also as a central organizing principle of institutional life. Schools promote meritocracy as a normative standard by presenting education as a legitimate pathway to upward mobility and by framing individual effort and achievement as the proper basis of social rewards (Chauvin et al., 2026; Van De Werfhorst, 2024). In this environment, students encounter meritocracy not only as discourse but also as a lived experience through grading, selection, and tracking, which make merit visible and consequential (Darnon et al., 2018; Resh & Sabbagh, 2014; Tang et al., 2025; Traini, 2022). In this same socialization process, students are also exposed to non-meritocratic factors, such as the influence of family background, social connections, and structural barriers, which may coexist with or undermine the meritocratic ideal (Bourdieu & Passeron, 1990; Goudeau & Croizet, 2017; Zhou, 2019). In this line, extant research shows that a stronger endorsement of meritocratic beliefs in school is associated with greater justification of inequality (Batruch et al., 2022; Lampert, 2013; Wiederkehr et al., 2015), even when students may simultaneously recognize structural constraints, reflecting a form of dual consciousness Tang et al. (2025). Taken together, these tensions make schools a crucial setting for examining how adolescents understand meritocracy, non-meritocratic constraints, and the fairness of unequal outcomes.
The present paper contributes to this line of research by examining how school-aged students perceive and endorse meritocracy. We identify two main contributions of this study. The first one is the conceptualization and measurement of meritocratic beliefs in school settings. Most of the research in this area has focused on the consequences of meritocratic beliefs, while less attention has been paid to their conceptualization and measurement. This is a crucial gap in the extant literature, as how meritocratic beliefs are conceptualized and measured can have important implications for the validity of research findings and their interpretation. Addressing this point, we approach the study of meritocratic beliefs at school from a multidimensional approach (Castillo et al., 2023), which distinguishes between perceptions (descriptive beliefs about how meritocracy works) and preferences (normative beliefs about how it should work), as well as between meritocratic principles (e.g., effort and ability) and non-meritocratic principles (e.g., family background and social connections). By adopting this perspective, we can better capture the complexity of adolescents’ beliefs about meritocracy and the role schools play in fostering them.
A second contribution of this study is to examine the stability and comparability of meritocratic beliefs across school stages and over time. Most research on meritocratic beliefs remains cross-sectional, limiting what we can infer about how these orientations develop through school-based socialization during adolescence. This matters because adolescence is precisely when reasoning about justice and inequality becomes more sophisticated and when school-based sorting mechanisms become increasingly salient (Henry & Saul, 2006; Resh & Sabbagh, 2014), potentially reshaping how students interpret meritocratic narratives in light of lived constraints (Allen, 2016; Tang et al., 2025). To address this, we test measurement invariance longitudinally within the same students across two waves (2023–2024) and across two cohorts of Chilean secondary students (8th and 10th graders). Establishing longitudinal invariance is essential for valid within-student comparisons: without it, observed change over time may reflect shifts in how items are interpreted rather than genuine change in the underlying constructs (Putnick & Bornstein, 2016; Van De Schoot et al., 2015). Cross-cohort invariance testing serves a complementary but distinct purpose: rather than assuming comparability across school stages, we treat the degree of equivalence as an empirical question whose answer is itself theoretically informative about how educational experience shapes the meaning students attach to meritocratic concepts.
According to these two contributions, the research questions guiding this study are as follows:
Do school-aged students distinguish between meritocratic and non-meritocratic principles, as well as between perceptions (“what is”) and preferences (“what should be”)?
Are these dimensions longitudinally stable within students over time, and does their measurement equivalence hold across school stages—or does educational experience reshape the meaning of meritocratic beliefs?
We argue that a multidimensional conception of meritocratic beliefs clarifies what adolescents actually endorse—descriptions, ideals, or both—and provides a stronger basis for valid developmental and longitudinal analysis. In the following sections, we review the literature on meritocratic beliefs in school settings and highlight the conceptual and methodological gaps this study addresses. We then present the study’s methodology, including the sample, measures, and analytical strategy, followed by the main results. Finally, we discuss the implications of our findings for understanding adolescents’ meritocratic beliefs and the consequences of these beliefs for attitudes toward inequality.
2 Theoretical and empirical background
2.1 What is meritocracy and how is it measured?
Meritocracy refers to a distributive system in which individual merit—typically defined as effort and personal ability—is treated as the primary criterion for allocating resources and rewards, rather than social origins or inherited privilege (Bell, 1972; Young, 1958). While Young (1958) coined the term as a dystopian critique of a society that justifies power and status only through “achievement,” it has since been re-appropriated as a positive ideal of fairness, especially in liberal and market-oriented societies (Mijs, 2021; Van De Werfhorst, 2024). From a sociological standpoint, meritocracy is, on the one hand, a cognitive judgment about how inequality works and, on the other hand, a moral lens through which people evaluate inequality in relation to merit (Castillo et al., 2019; Heuer et al., 2020). Precisely because it frames outcomes as earned, meritocratic ideals can end up reinforcing inequality: “winners” are encouraged to see their position as deserved, while “losers” are pushed toward self-blame rather than structural critique (García-Sierra, 2023; Mijs, 2016a; Sandel, 2020). The key point is that meritocracy often promises to mitigate inherited advantage, but in practice, it can legitimize unequal structures by translating social privilege into individualized narratives of deservingness.
Research in adult populations has mapped both the determinants and consequences of meritocratic perceptions. On the “causes” side, higher-status individuals —those with more education, income, and occupational prestige—and upward mobile individuals are consistently more likely to endorse merit-based explanations for social outcomes (Duru-Bellat & Tenret, 2012; García-Sánchez et al., 2018; Mijs et al., 2022; Traini et al., 2025). On the “consequences” side, perceiving one’s society as meritocratic is associated with lower support for redistribution and egalitarian policies (Hoyt et al., 2023; Pañeda-Fernández et al., 2026; Tejero-Peregrina et al., 2025), as well as greater acceptance of inequality and market-based allocation logics (Castillo et al., 2025, 2019). Experimental evidence is consistent with a causal pathway in which exposure to upward-mobility information or “self-made” narratives reduces redistributive support and increases tolerance of inequality and system-justifying orientations, whereas exposure to low or downward mobility produces the opposite pattern—effects that are often partly mediated by strengthened meritocratic perceptions (Deng & Wang, 2025; Matamoros-Lima et al., 2025). Taken together, this literature suggests that meritocratic perceptions are systematically associated with social position and redistributive attitudes. In particular, they are associated with whether inequality is interpreted primarily as the outcome of individual performance or as a condition that warrants collective intervention.
The research agenda on meritocratic beliefs has faced some challenges regarding the way in which meritocracy is conceptualized and measured. Some studies have relied on narrow operationalizations that equate meritocracy with the social valuation of effort (Mijs, 2021; Wiederkehr et al., 2015), often reflecting simplified readings of Young’s (1958) formulation (Merit = Effort + Intelligence), whereas others treat “meritocracy” as interchangeable with broader constructs such as system justification (Day & Fiske, 2017; Jost et al., 2004), beliefs about social mobility (Deng & Wang, 2025; McCoy & Major, 2007), or generalized support for equal opportunity (Batruch et al., 2022; Darnon et al., 2018). As a result, conceptually distinct orientations are frequently collapsed into a single indicator, and the distinction between descriptive perceptions of how rewards are allocated and normative preferences about how they should be allocated is often acknowledged but rarely implemented analytically.
A related limitation concerns how studies account for non-meritocratic factors, such as family wealth, social connections, or other structural advantages. As Castillo et al. (2023) notes, much survey research relies on item batteries that ask respondents to rate the importance of effort, talent, family background, networks, or luck for “getting ahead,” and then reduces these factors into a single score. This becomes especially problematic when researchers construct a difference-or-continuum measure—treating meritocratic and non-meritocratic explanations as opposite ends of the same scale (e.g., by subtracting “non-merit” from “merit,” as in the Reynolds & Xian, 2014 approach). Such operationalizations embed a strong zero-sum assumption—namely, that endorsing merit necessarily implies rejecting structural or relational advantages—thereby ruling out, by construction, the empirical possibility that both types of beliefs coexist. Recent debates, including the exchange between Mijs (2026) and Wiesner & Sachweh (2026), underscore this point by arguing for measures that capture meritocratic beliefs (e.g., hard work) in parallel, rather than as a residual of the relative importance assigned to non-meritocratic factors such as privilege. Complementary empirical work has raised similar concerns: C. Liu & Wang (2025) shows that meritocratic endorsement may remain stable even as recognition of structural constraints changes; Tang et al. (2025) motivates “dual consciousness” but still risks obscuring it when operationalizations force relative trade-offs; Kwon & Pandian (2024) identify three attitudinal clusters in Europe—instrumental, idealized merit, and ambivalent —showing that support for merit can coexist with recognition of social connections in distinct configurations, whereas Zhu (2025) argues directly that meritocratic and structural explanations are not zero-sum, but often accumulate rather than replace one another. The measurement implication is straightforward: if individuals can simultaneously believe that effort matters and that family resources or connections matter, then unidimensional indices—especially subtraction scores—can manufacture artificial “neutral” positions and blur substantively distinct belief profiles.
As a response to several limitations in the empirical study of meritocracy, Castillo et al. (2023) proposed a multidimensional framework for conceptualizing and measuring meritocratic beliefs in survey research. This proposal decomposes meritocratic beliefs along two analytically independent axes: preferences versus perceptions, and meritocratic versus non-meritocratic allocation principles. Preferences capture normative ideals about how rewards should be distributed (e.g., whether effort and ability ought to determine life chances). In contrast, perceptions capture descriptive evaluations of how society actually works (e.g., whether observed inequalities reflect merit-based processes) (Janmaat, 2013). In parallel, the framework conceptualizes meritocratic elements (e.g., effort, talent) and non-meritocratic elements (e.g., social origins, inherited privilege, networks) as distinct components rather than as opposite poles of a single continuum. This yields four non-redundant constructs—meritocratic preferences, meritocratic perceptions, non-meritocratic preferences, and non-meritocratic perceptions— allowing combinations that older measures tend to collapse, such as endorsing meritocracy as an ideal while recognizing the weight of family background and connections. A characteristic of this proposal is its minimalist design, which makes it well-suited for large-scale surveys with limited questionnaire space; however, this parsimony entails a trade-off, as each factor is measured with only two items, potentially constraining reliability and content coverage relative to longer batteries.
Evidence in adult population using confirmatory factor analysis methods suggests that respondents are capable of differentiating among the four meritocratic dimensions. Besides, the dimensions show systematic associations. For instance, stronger perceptions that non-meritocratic factors are rewarded tend to co-occur with stronger preferences for meritocratic allocation. This configuration aligns with Zhu’s (2025) “dual consciousness,” here specified as the coexistence of (a) meritocratic and non-meritocratic beliefs and (b) legitimacy judgments (“should”) alongside descriptive assessments (“is”).
Regarding research in the school context, the challenges identified in measuring meritocratic beliefs have been barely tackled. A recent exception is a study by Chauvin et al. (2026) who proposes multidimensional measure of school meritocracy that differentiates equity and ability from a general factor, although it refers only to teachers and remains restricted to perceived meritocracy. Another study in this from Castillo et al. (2024) applies the multidimensional framework referred above to a sample of Chilean 10th graders. The results show that students can differentiate between perceptions and preferences, as well as between meritocratic and non-meritocratic principles. However, the study does not test whether these dimensions are stable across age cohorts or over time, which limits our understanding of their developmental trajectory and comparability.
2.3 This study
This study examines how students understand meritocracy during a formative stage of socialization—schooling—and whether these understandings can be measured reliably and comparably. Building on Castillo et al.’s (2023) conceptual and measurement framework, we test whether students differentiate between (i) perceptions about how meritocracy operates in society (“what is”) and (ii) preferences about how it should operate (“what ought to be”), and whether these judgments distinguish meritocratic elements (effort, talent) from non-meritocratic elements (family wealth, personal contacts). Empirically, beyond assessing factorial validity, the paper focuses on measurement stability—whether the same latent constructs are captured comparably across school stages and across time within the same students.
Establishing measurement invariance is essential because it provides the empirical foundation for valid comparisons (Chen, 2007; Putnick & Bornstein, 2016). Without it, observed differences between groups or across time could reflect changes in how the instrument functions rather than substantive differences in the underlying constructs (Putnick & Bornstein, 2016; Van De Schoot et al., 2015). In other words, measurement invariance tests whether students at different ages, or at different time points, interpret and respond to the items in the same way—ensuring that a given latent score carries the same meaning regardless of when or to whom it is administered (Van De Schoot et al., 2012). This is particularly important in developmental research: if the measurement model differs between cohorts or waves, comparisons of means, variances, or covariances become uninterpretable, as they conflate measurement artifacts with true developmental or contextual variation (Y. Liu et al., 2017; Putnick & Bornstein, 2016).
The study leverages longitudinal data from two cohorts of Chilean secondary students: 8th graders (approximately 12–13 years old) and 10th graders (approximately 15–16 years old) at baseline, followed across two waves. These cohorts are theoretically strategic because they capture distinct stages of adolescence, when abstract reasoning about justice and inequality becomes more sophisticated and school-based sorting mechanisms (grades, tracking, peer comparisons) become increasingly salient (Henry & Saul, 2006; Resh & Sabbagh, 2014). Developmental research further suggests that by around age 10, children can already articulate judgments about social differences, typically emphasizing individual, merit-based explanations while beginning to incorporate opportunity-based accounts, especially those involving discrimination (Imhoff & Brussino, 2025; Sigelman, 2013). As students move through the school system, cumulative exposure to evaluation and selection can make the limits of effort as a sufficient explanation for success more visible, generating a potential “reality shock” as meritocratic discourse clashes with experienced inequality and constraints (Allen, 2016). Both cohorts are embedded within the same highly stratified educational system, yet differ in their cumulative exposure to schooling and to the meritocratic narratives the system promotes. Accordingly, we test measurement invariance across the two cohorts and across waves to ensure that any observed differences or changes can be interpreted substantively rather than as artifacts of measurement non-equivalence.
2.3.1 Hypotheses
H_1 (Dimensional differentiation). Students’ meritocratic beliefs are best represented by four distinct factors: perceived meritocracy, perceived non-meritocracy, preferred meritocracy, and preferred non-meritocracy.
H_2 (Between-cohort measurement invariance). The four-factor model of meritocratic beliefs is invariant across age cohorts.
H_3 (Longitudinal measurement invariance). The four-factor model of meritocratic beliefs is invariant across waves within students.
3 Method
3.1 Participants
This study draws on secondary data from the Panel Survey on Education and Meritocracy (EDUMER) for the 2023 and 2024 waves, covering school-age students1. The primary objective of the survey was to examine students’ beliefs, attitudes, and behaviors concerning meritocracy, inequality, and citizenship. The questionnaire was administered to sixth-grade and first-year secondary students from nine schools in the Metropolitan and Valparaíso regions of Chile. The sampling strategy was non-probabilistic and lacked quota controls; however, a minimum sample size of 900 students was established to ensure adequate statistical power. After data processing, the final analytical sample comprises 846 students for Wave 1 (386 girls, 421 boys, 39 identifying as other), and the second wave followed 662 of them (303 girls, 338 boys, 21 identifying as other), yielding a retention rate of 78.3% (attrition = 21.7%). The primary causes of attrition were school transfers between academic years and student absenteeism, reported to be high in several schools. Missing data within waves were handled via listwise deletion. To assess whether attrition introduced systematic bias, we compared retained and non-retained students on all Wave 1 scale items and cohort membership using independent-samples t-tests and chi-square tests. No statistically significant differences were found between groups on any of the meritocracy dimensions or on cohort distribution (all pp p > .05), suggesting that attrition was largely non-systematic with respect to the constructs under study. Results of these comparisons are reported in the Supplementary Material.
Chile provides a theoretically productive setting for this investigation that extends beyond its national boundaries. Its educational system combines high stratification, an active school market with competitive selection mechanisms, and persistent socioeconomic inequality—features shared, to varying degrees, by many Latin American countries and increasingly present in European and East Asian systems undergoing marketization (Traini, 2022; Van De Werfhorst, 2024). At the same time, Chile’s meritocratic discourse is particularly explicit in school culture, making it a strong case for detecting how students internalize, question, or reconcile meritocratic and non-meritocratic beliefs. Findings on the dimensional structure and longitudinal stability of these beliefs are therefore likely to travel to other highly stratified systems, while findings on cross-cohort meaning shifts may be especially relevant where school-based sorting is intense and cumulative.
3.2 Procedure
Data collection was conducted by a professional research firm using a Computer-Assisted Web Interviewing (CAWI) approach, based on online questionnaires. All participants received an informed consent form that was reviewed and validated by a parent or legal guardian before participation. To enable longitudinal linkage while protecting confidentiality, the survey firm generated anonymous unique identifiers for each student; no directly identifying information (e.g., names) was collected for students or their guardians in the analytic files.
3.3 Measures
3.3.1 Scale of perceptions and preferences of meritocracy
Meritocratic and non-meritocratic perceptions and preferences were measured using the same items proposed in the original scale (Castillo et al., 2023). Each of the four dimensions of the scale is measured by two items. The dimensions are:
Perceived meritocracy: the extent to which effort and ability are rewarded in Chile,
Perceived non-meritocracy: the extent to which success is perceived as linked to connections and family wealth,
Preference for meritocracy: agreement with that those who work harder or are more talented should be better rewarded,
Preference for non-meritocracy: agreement with that it is acceptable for individuals with better connections or wealthy parents to achieve greater success (see Table 1).
Each item is rated on a four-point Likert scale ranging from “strongly disagree” (1) to “strongly agree” (4), therefore higher scores indicate stronger endorsement of the corresponding perception or preference.
It should be noted that each factor is measured by only two indicators, which is the minimum required for identification in a CFA framework. This is a deliberate trade-off in the original scale design (Castillo et al., 2023), prioritizing parsimony for large-scale survey use over content breadth and reliability. As a consequence, factor-level estimates should be interpreted with appropriate caution: internal consistency cannot be computed in the conventional sense, and the two items per dimension may not fully capture the construct’s theoretical range. This constraint is acknowledged throughout the interpretation of results.
3.3.2 Cohort level
To distinguish students’ academic level across waves for conditional and multi-group invariance analyses, we created a cohort indicator capturing whether the respondent belonged to the primary (sixth grade) or secondary (first-year secondary) cohort at the time of each survey wave. Descriptive statistics2 by cohort are reported in Table 2.
3.4 Analytical strategy
3.4.1 Measurement model and estimation
To evaluate the underlying structure of the scale, we employed Confirmatory Factor Analysis (CFA) based on a measurement model with four latent factors, using Diagonally Weighted Least Squares with robust correction (WLSMV) estimation. This estimator is particularly suitable for ordinal data, such as four-point Likert-type scales, as it avoids the bias associated with treating categorical data as continuous (Kline, 2023).
Model fit was assessed following the guidelines of Brown (2015) using a triangulated approach that considers multiple indices jointly rather than applying fixed pass/fail cutoffs. The Comparative Fit Index (CFI) and Tucker-Lewis Index (TLI) values above 0.95 indicate good fit, with values between 0.90 and 0.95 considered acceptable; the Root Mean Square Error of Approximation (RMSEA) indicates good fit below 0.06 and acceptable fit below 0.08; and the Chi-square statistic provides an additional reference, with p > 0.05 and a ratio of Chi-square to degrees of freedom below 3 suggesting adequate fit. Because these indices capture different aspects of model-data correspondence and can diverge in practice, fit evaluation follows the overall pattern across indices rather than any single criterion (Kline, 2023).
3.4.2 Measurement invariance
A key contribution of this study is its assessment of measurement stability through factorial invariance testing (Davidov et al., 2014). We implemented two complementary strategies: cross-group invariance across school levels (primary vs. secondary students) and longitudinal invariance across two panel waves. Given the ordinal nature of the items, we used estimation procedures appropriate for ordered categorical indicators, following Liu et al. (2017) for longitudinal invariance and Svetina et al. (2020) for cross-group tests. For the longitudinal analyses, we adopted the standard hierarchical sequence of four nested models—configural (same factor structure), metric (equal loadings), scalar (equal thresholds/intercepts), and strict (equal residual variances). For the cross-group analyses, we estimated a configural model, then a threshold-invariant model, and finally a model jointly constraining thresholds and factor loadings across groups.
In addition to the traditional chi-square difference test, we assessed invariance using changes in approximate fit indices. Following Chen’s (2007) recommendations for adequate sample sizes, we treated \DeltaCFI as the primary criterion and \DeltaRMSEA as a supplementary criterion. Noninvariance was indicated by a decrease in CFI of at least .010 (i.e., \DeltaCFI \leq −0.010), together with an increase in RMSEA of at least .015 (i.e., \DeltaRMSEA \geq 0.015).
All analyses were performed using the lavaan package in R version 4.5.2. The hypotheses of this research were pre-registered on the Open Science Framework (OSF).
4 Results
4.1 Measurement model
Figure 1 presents the standardized factor loadings and overall fit indices of the general measurement model estimated on the pooled analytical sample across cohorts and waves. Evaluated across indices jointly, the model shows acceptable fit: CFI = 0.97 meets the conventional threshold for good fit, and RMSEA = 0.07 falls within the acceptable range (below 0.08), though above the more stringent 0.06 benchmark. The TLI = 0.94 falls just below the 0.95 threshold, indicating slightly imperfect fit on this index. Taken together, the pattern across indices suggests that the four-factor structure captures the main covariance structure in the combined sample adequately, even if fit is not uniformly strong. Importantly, the primary goal of this model is to establish the plausibility of the factor structure as a basis for invariance testing, rather than to achieve optimal fit in a single cross-sectional solution; in this context, acceptable fit across the majority of indices is sufficient to proceed (Brown, 2015).
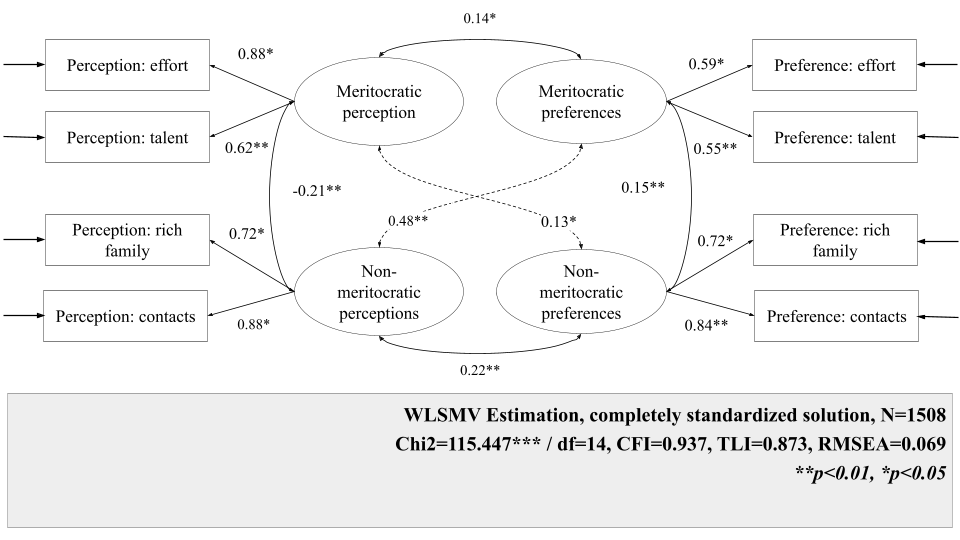
All standardized factor loadings are statistically significant and generally moderate to strong, though their magnitude varies across dimensions. For meritocratic perceptions, both indicators load positively on the latent factor, with effort showing a particularly strong loading (\beta = 0.88) and talent a moderately strong loading (\beta = 0.62). Meritocratic preferences exhibit more even, but somewhat weaker, loadings for effort (\beta = 0.59) and talent (\beta = 0.55). For non-meritocratic perceptions, both indicators load strongly, especially contacts (\beta = 0.88), followed by coming from a rich family (\beta = 0.72). Non-meritocratic preferences also show strong and relatively balanced loadings, with contacts (\beta = 0.84) and rich family (\beta = 0.72), indicating that both indicators are similarly representative of this latent dimension.
The latent correlations reveal a differentiated structure among the four dimensions. Meritocratic perceptions and meritocratic preferences are positively correlated (r = 0.14), consistent with some alignment between what students perceive is rewarded and what they believe should be rewarded. Meritocratic and non-meritocratic perceptions are negatively correlated (r = −0.21), suggesting that students who perceive greater meritocracy in society tend to view a weaker role for connections and family wealth. At the same time, non-meritocratic perceptions are positively related to meritocratic preferences (r = 0.48, strongest correlation), suggesting that perceiving society as rewarding contacts and wealth may coincide with stronger endorsement of meritocratic ideals. Finally, meritocratic and non-meritocratic preferences are modestly positively correlated (r = 0.15), and non-meritocratic perceptions and preferences are also positively associated (r = 0.22), indicating that recognizing non-meritocratic mechanisms in practice is linked to a greater acceptance of their legitimacy, albeit to a moderate extent.
To assess whether conclusions about the measurement model are sensitive to attrition and missing data, we conducted two robustness checks. First, we re-estimated the general CFA model using only the subsample of students retained across both waves (n = 662) and compared factor loadings, latent correlations, and fit indices against the full Wave 1 sample. Results were substantively identical, with factor loadings differing by no more than .03 across specifications and fit indices remaining within the same range (CFI = 0.97; RMSEA = 0.07). Second, as reported in the Participants section, baseline comparisons between retained and non-retained students showed no significant differences on scale items or cohort membership. Taken together, these checks suggest that the measurement model results are not materially driven by selective attrition.
4.2 Invariance analysis
We assessed measurement invariance through a hierarchical sequence of nested confirmatory factor analysis models, imposing progressively stricter equality constraints to evaluate whether the measurement model was comparable across time and cohorts. For longitudinal invariance, we followed the approach in Y. Liu et al. (2017) and estimated the model simultaneously across the two waves. We began with a configural model that specified the same factor structure at each wave while allowing item parameters (factor loadings, thresholds/intercepts, and residual variances) to vary freely; this model served as the baseline for subsequent comparisons. We then tested metric (weak) invariance by constraining factor loadings to equality across waves, followed by scalar (strong) invariance by additionally constraining item thresholds (and, where applicable, intercepts) to equality over time—an essential step with ordered-categorical indicators to ensure that response categories map onto equivalent points on the latent continuum and thus permit meaningful comparisons of latent means. Finally, we evaluated strict invariance by further constraining residual variances to equality across waves. To assess invariance between cohorts, we followed the sequential procedure proposed by Svetina et al. (2020) for ordinal indicators: we estimated a configural model, then a threshold-invariant model, and finally a model that jointly constrained thresholds and factor loadings across groups.
In the following sections, we proceed as follows. First, we present descriptive statistics for the meritocracy scale among the comparison groups. Second, we report the results of the measurement invariance analyses, emphasizing the highest level of invariance achieved in each comparison. Finally, we examine potential sources of non-invariance to identify which items or parameters are responsible for the lack of equivalence.
4.2.1 Longitudinal invariance
Figure 2 displays the response distributions for the meritocracy scale, distinguishing perceptions (Panel A) from preferences (Panel B) across waves. In Wave 1, perceptions show high levels of agreement across all items, especially for contacts (77%), talent (74%), and having rich parents (71%), with effort also widely endorsed (67%); at the same time, sizeable minorities disagree (33% for effort, 29% for rich parents, and 27% for talent), indicating a dual recognition in which students strongly acknowledge non-meritocratic determinants (contacts and parental wealth), while within the meritocratic dimension they view talent as more influential than effort, which is perceived as the least rewarded. Wave 1 preferences show the inverse pattern: effort is overwhelmingly endorsed as the legitimate basis for rewards (87%), far exceeding its perceived role in practice; views on talent are split (54% agree, 45% disagree); parental wealth remains nearly evenly divided; and contacts are relatively more accepted than rejected (61% vs. 39%), suggesting that this factor is not uniformly considered illegitimate in the “ideal” society.
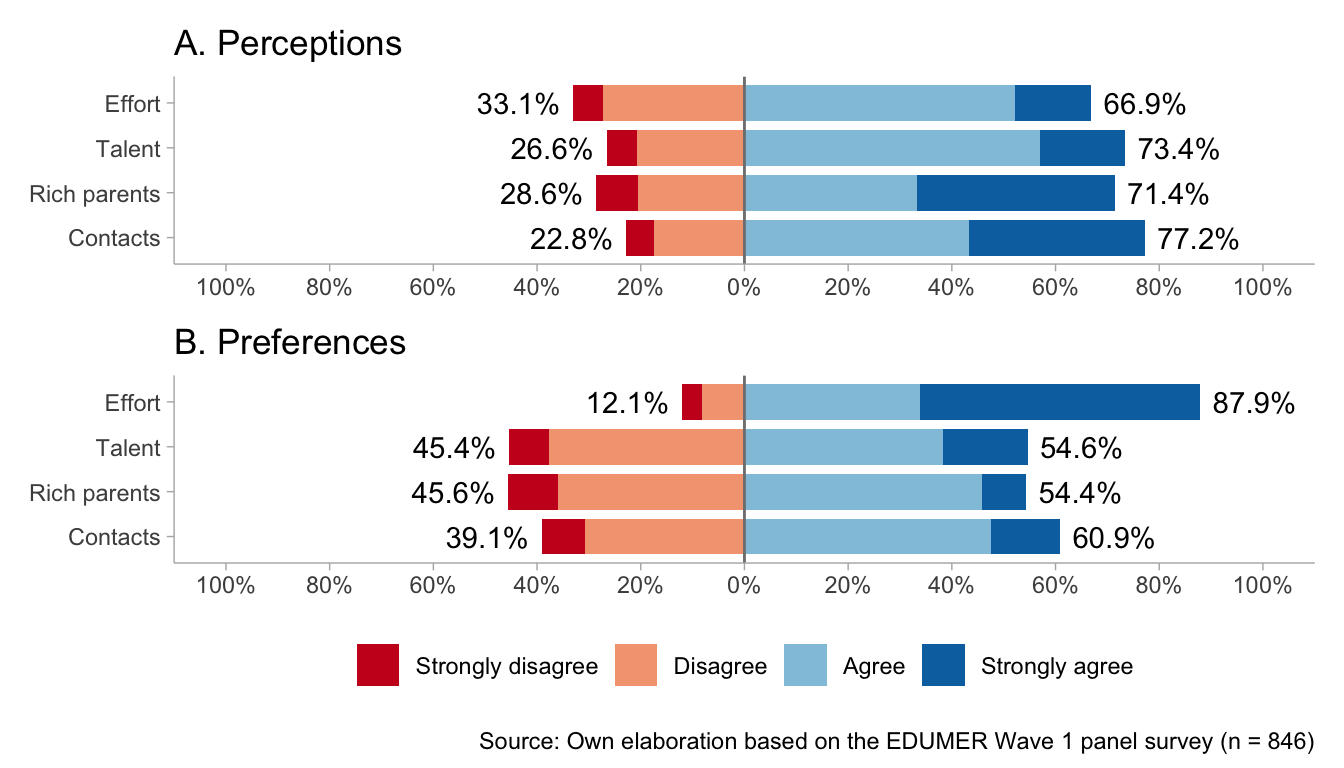
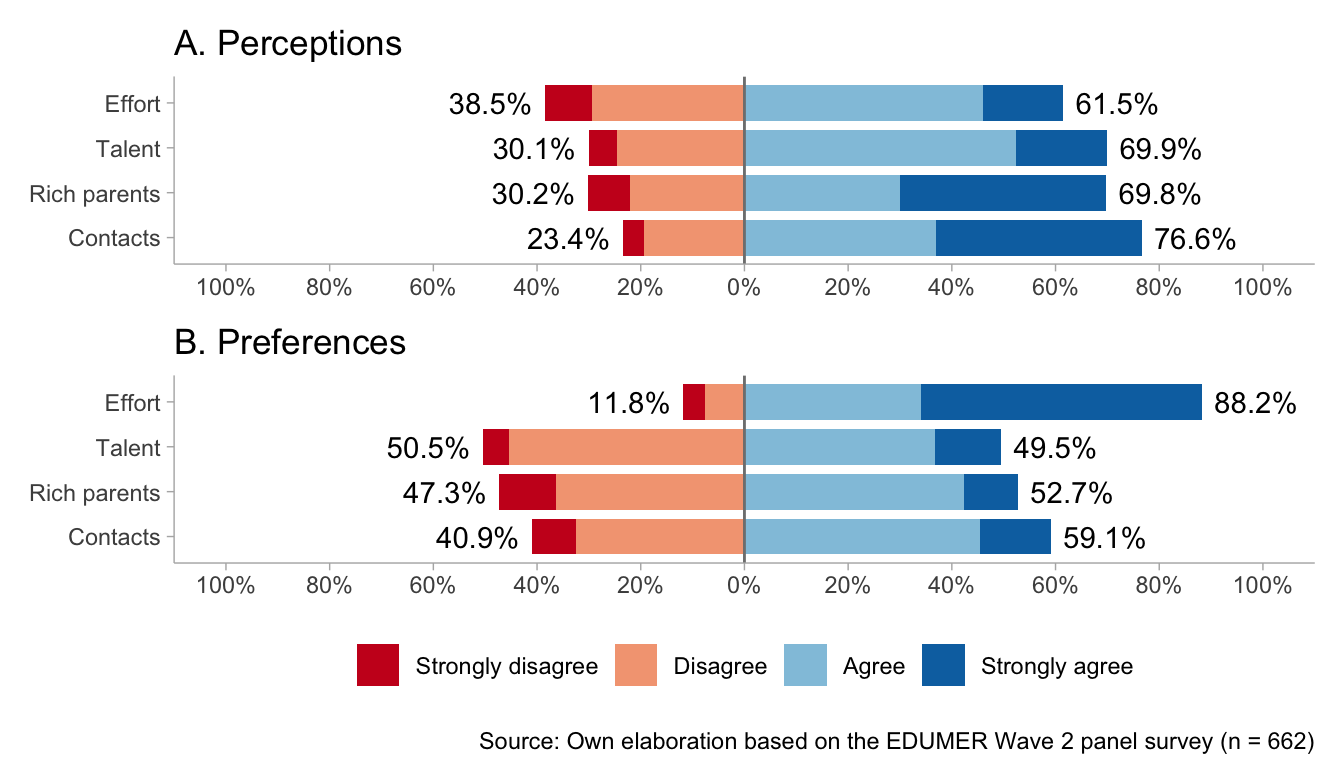
Wave 2 largely replicates these patterns with modest shifts. In perceptions, endorsement of effort declines (62%), whereas contacts (76%), talent (70%), and parental wealth (70%) remain consistently high. In preferences, support for effort remains highly stable (88%), while support for talent declines, with disagreement rising to 51%. Attitudes toward parental wealth remain evenly divided, and contacts continue to be more accepted than rejected (59% vs. 41%), albeit far below the near-consensus around effort. Overall, both waves reveal a stable gap: students perceive social outcomes as strongly shaped by non-meritocratic factors (especially contacts and family wealth) and, to a lesser extent, talent, yet they overwhelmingly endorse an effort-centered meritocratic ideal. This persistent divergence between perceived reality and normative preferences highlights a key paradox—strong support for meritocracy as a principle alongside skepticism about its realization in practice.
Table 3 reports the results of the longitudinal invariance tests. Overall, the scale achieved the strongest level of invariance (strict invariance) across the two waves. The strict model showed good fit, \chi^2(84) = 130.17, CFI = 0.991, RMSEA = 0.031 (90% CI: 0.020–0.040). Moreover, compared with the strong (scalar) model, the deterioration in fit was negligible: \Delta \chi^2(4) = 1.635, \DeltaCFI = 0.000, and \DeltaRMSEA = -0.002. These differences fall well within commonly used cutoffs for invariance evaluation (Chen, 2007), indicating that constraining residual variances in addition to loadings and thresholds/intercepts is tenable. Substantively, this implies that the item–factor relations are stable over time (metric invariance) and that, for a given level of the latent trait, respondents are expected to endorse the same response categories across waves (scalar invariance), supporting the comparability of scores and latent parameters within students over time.
As an additional diagnostic, we examined potential sources of localized misfit using univariate score tests showing the increase of misfit at each step of the invariance hierarchy (configural, metric, scalar, and strict). Across steps, the score tests provided no evidence of meaningful violations of the imposed equality constraints, indicating that a small subset of parameters did not drive the constraints. The supplementary materials report the global score tests and the smallest p-values observed at each step.
4.2.2 Cohort invariance
Figure 3 shows response distributions by cohort, separating perceptions and preferences. In primary education, perceived rewards are similar for effort and talent (both 76% agree). Contacts (67%) and a rich-family background (59%) are also seen as rewarded, and these non-meritocratic factors elicit the most disagreement within the cohort (41% disagree with rich-family background; 33% with contacts). In preferences, effort is clearly dominant (84% agree), whereas talent and a rich family background split evenly. Notably, 62% consider it as good that those who have good contacts do better in life (39% disagree).
In secondary education, perceptions shift: disagreement with the idea that effort is rewarded increases (45%), and agreement decreases (55%). Disagreement about talent also increases (31%). The largest differences concern non-meritocratic factors, which are overwhelmingly perceived as rewarded (82% for rich-family background; 86% for contacts), with a stronger concentration in the highest agreement category. Preferences again strongly favor effort (92%), while views on talent, rich-family background, and contacts remain mixed (roughly 45% disagree to 58% agree across items).
Table 4 summarizes the cross-cohort invariance tests. The scale achieves configural invariance between primary and secondary students, indicating the same four-factor structure across groups, but does not support threshold invariance and therefore also fails to meet the prerequisites for metric or scalar invariance. Following the indications by Wu & Estabrook (2016) and Svetina et al. (2020) for group invariance testing, we estimate a first invariance level restricting the tresholds, and further a second invariance level with tresholds and loadings restricted. Imposing equality constraints on thresholds led to a deterioration in model fit (\DeltaCFI = −.013; \DeltaRMSEA = .013) that exceeds Chen’s (2007) recommended cutoffs for threshold/intercept invariance. This pattern indicates systematic differences in how response categories relate to the underlying latent constructs across cohorts. Substantively, primary and secondary students do not use the response scale equivalently when evaluating meritocratic and non-meritocratic criteria, which limits the interpretability of direct cross-level comparisons of latent means or other latent-score differences.
To locate the source of cross-cohort non-invariance, we inspected univariate score tests from lavTestScore for the threshold-invariant model. The largest localized violations were concentrated in the thresholds of the perceived-effort item, especially the second threshold (\chi^2=10.12, p=.001), with the first threshold also among the top contributors (\chi^2=7.55, p=.006). Substantively, the younger and older cohorts appear to use the response options differently when judging whether effort is rewarded in society, consistent with socialization processes through which older students may adopt a more critical view of how far effort translates into success.
4.2.3 Conditional longitudinal invariance by cohort
Despite the lack of cohort measurement invariance, we examined whether plausible cohort-related heterogeneity could compromise longitudinal invariance by re-estimating the longitudinal invariance sequence while controlling for cohort (dummy-coded) as a covariate predicting each latent factor. Model fit remained good across all steps—from the configural baseline to the strict model—and consistently met conventional standards; for instance, the strict invariance model with cohort control showed \chi^2(92) = 131.64, CFI = .991, and RMSEA = .027. Importantly, including cohort as a predictor did not materially alter model fit or the invariance conclusions, suggesting that the equality constraints over time are tenable even after accounting for cohort differences in average latent factor levels.
This result has two main implications. First, it strengthens the claim that the measurement properties of the scale are temporally stable within individuals: observed over-time comparisons are not driven by shifts in how primary versus secondary students use the response categories, but reflect stability (or change) in the underlying latent constructs. Second, and substantively, cross-cohort non-invariance should not be read merely as a technical limitation on comparability. Rather, it is an informative finding in its own right: the fact that threshold non-equivalence is concentrated in the perceived-effort item suggests that the meaning of “effort being rewarded” shifts with educational experience. Primary and secondary students do not simply differ in how much they perceive effort to be rewarded—they appear to interpret the question through different reference frames, likely reflecting cumulative exposure to school-based sorting and the growing visibility of structural constraints as students progress. Cross-level comparisons of latent means should therefore be made with caution or handled via partial invariance or cohort-specific models, while within-person longitudinal analyses pooling both cohorts remain well-supported.
5 Discussion
The first hypothesis proposed that students’ meritocratic beliefs would be best represented by four distinct factors: perceived meritocracy, perceived non-meritocracy, preferred meritocracy, and preferred non-meritocracy. The confirmatory factor analyses support this expectation: overall, the scale performs well in the school-aged population, with satisfactory model fit, strong factor loadings, and meaningful correlations among factors. Consistent with evidence for adult population (Castillo et al., 2023), these results indicate that even at an early stage of school socialization, students distinguish between perceptions and preferences, and between meritocratic and non-meritocratic principles.
These findings contribute to ongoing debates about how meritocratic beliefs should be conceptualized and measured (Kwon & Pandian, 2024; Mijs, 2026; Zhu, 2025). Consistent with the distinction between “what is” and “what should be,” and with earlier attempts to operationalize this split (e.g., Castillo et al., 2023; Duru-Bellat & Tenret, 2012), perceived and preferred meritocracy are empirically separable already among school-aged students. Substantively, this matters because the same normative endorsement of merit can carry different meanings depending on perceived reality: high perceived meritocracy is more compatible with affirming existing arrangements, whereas low perceived meritocracy can reflect dissatisfaction and a demand for greater fairness. At the same time, our results show that meritocratic and non-meritocratic principles coexist rather than forming opposite poles of a single continuum. This directly challenges zero-sum measurement strategies—such as subtraction scores or single indices based on ratings of effort, talent, family background, and networks—that presuppose endorsing merit entails rejecting privilege (Reynolds & Xian, 2014; Wiesner & Sachweh, 2026). Instead, the evidence is consistent with accounts in which merit endorsement may remain stable as recognition of constraints increases (C. Liu & Wang, 2025), and with the idea that change may occur primarily through rising salience of non-merit factors rather than displacement of merit ideals (Tang et al., 2025). The correlational pattern in our data reinforces this interpretation: perceived non-meritocracy is positively associated with stronger meritocratic preferences, suggesting a normative-reactive response to perceived unfairness (cf. Castillo et al., 2023). Importantly, this kind of configuration is precisely what zero-sum indices can obscure by collapsing qualitatively different profiles into the same “middle” value, thereby risking misinterpretation of apparent “declines” in meritocracy as weaker merit endorsement rather than increased recognition of non-meritocratic constraints (Zhu, 2025).
These results also align with the broader literature on meritocracy in educational settings. Schools circulate meritocratic beliefs as a culturally legitimate narrative of mobility while institutionalizing merit through grading, selection, tracking, and curricular practices that make it visible and consequential (Mijs, 2016b; Resh & Sabbagh, 2014; Tang et al., 2025; Traini et al., 2025). Chauvin et al. (2026) similarly highlights multidimensionality by distinguishing ability and equity, but their measure remains confined to perceived meritocracy and combines school-specific dimensions with a broader factor. Our findings extend this line of work by showing that students also differentiate preferences and incorporate non-meritocratic considerations, rather than fitting them into a single continuum. Given that school-based meritocracy is associated with inequality legitimation and systematic differences in students’ attitudes (Batruch et al., 2022; Castillo et al., 2024; Darnon et al., 2018; Wiederkehr et al., 2015), a key implication is that reported “meritocracy effects” are likely dimension-specific: perceptions are not equivalent to preferences, and meritocratic preferences need not have the same implications as non-meritocratic ones. Distinguishing these dimensions is therefore essential both for conceptual clarity and for identifying potentially distinct social and attitudinal consequences.
The second hypothesis stated that the measurement model would be stable over time (i.e., longitudinally invariant within the same students), and the results support this expectation. Achieving strict longitudinal invariance indicates that the scale functions equivalently across waves, meaning it measures the latent constructs in the same way at each time point. This is crucial in developmental and school-based research because, without invariance, apparent change can be ambiguous: it may reflect shifts in how students interpret items, use response categories, or update their reference frames rather than genuine change in meritocratic beliefs (Y. Liu et al., 2017; Putnick & Bornstein, 2016; Van De Schoot et al., 2015). With strict invariance in place, observed differences over time can be interpreted more confidently as substantive within-student change rather than a measurement artifact. Methodologically, this strengthens longitudinal inference and supports models such as latent mean comparisons or growth models under a consistent measurement structure (Putnick & Bornstein, 2016). Substantively, the results suggest continuity in how students organize the underlying dimensions of meritocracy across the study period, providing a firmer basis for interpreting developmental patterns than is typical in much of the meritocracy literature (e.g., Chauvin et al., 2026; C. Liu & Wang, 2025; Tang et al., 2025), where longitudinal invariance is rarely tested.
The third hypothesis proposed invariance across educational levels (primary vs. secondary). The results did not support this expectation in terms of full metric or scalar equivalence: non-invariance appears concentrated in perceived meritocracy, specifically in how students at different school stages use the response scale when judging whether effort is rewarded in society (Putnick & Bornstein, 2016; Van De Schoot et al., 2012). However, rather than treating this solely as a measurement limitation, we interpret it as a substantively meaningful finding. Cross-cohort non-invariance indicates that primary and secondary students do not merely differ in their level of perceived meritocracy—they appear to attach different meanings to the concept of effort being rewarded. A plausible explanation is that cumulative exposure to grading, selection, tracking, and broader social inequalities produces a progressive “reality shock” (Tang et al., 2025), such that older students evaluate the same item through a more critical lens, making the construct itself partially non-equivalent across stages. This finding adds an important boundary condition to measurement comparability: the multidimensional framework travels well within students over time, but cross-stage comparisons require caution and, ideally, stage-sensitive item formulations or partial invariance approaches.
6 Conclusion
Meritocratic beliefs remain widespread despite rising inequality and limited mobility, shaping how people interpret achievements in society (Mijs, 2021; Sandel, 2020). Schools are central to this process because they promote meritocracy culturally and institutionalize it through evaluation, tracking, and selection that make merit consequential in everyday school life (Mijs, 2016b; Resh & Sabbagh, 2014; Traini et al., 2025). Consistent with this, stronger endorsement of school meritocracy is linked to greater legitimation of inequality and broader distributive orientations beyond education (Batruch et al., 2022; Darnon et al., 2018; Wiederkehr et al., 2015). Yet empirical work has lagged conceptually and operationally: studies often conflate perceptions with preferences and force merit and non-merit into opposition—sometimes via zero-sum indices—thereby obscuring dual configurations (Reynolds & Xian, 2014; Wiesner & Sachweh, 2026). Extending Castillo et al.’s (Castillo et al., 2023) multidimensional framework to adolescents, we use panel survey data from two Chilean cohorts (8th and 10th graders) across two waves (2023–2024) to test whether students distinguish merit from non-merit and perceptions (“what is”) from preferences (“what should be”), and whether these dimensions are stable over time and comparable across cohorts/school levels. Our contribution seeks to clarify what adolescents actually endorse—ideals, descriptions, or both—and to strengthen the basis for developmental and longitudinal inference about meritocratic socialization.
Our results support a four-factor structure—perceived meritocracy, perceived non-meritocracy, preferred meritocracy, and preferred non-meritocracy—showing that Chilean adolescents differentiate perceptions from preferences and merit from non-merit, and that merit endorsement can coexist with recognition of non-meritocratic advantage. This multidimensionality has a direct methodological implication for research on school meritocracy: these beliefs should be modeled as distinct but related dimensions rather than collapsed into single scores, especially zero-sum indices. Consistent with this, perceived non-meritocracy is positively associated with stronger meritocratic preferences, suggesting that recognizing unfair advantages can intensify demands that rewards should follow merit. Importantly, the measurement structure is longitudinally invariant within students, providing a robust basis for interpreting change (or stability) over time as substantive rather than as a measurement artifact. At the same time, cross-cohort non-invariance is itself a substantive finding rather than merely a technical caveat: comparisons across educational stages require caution because the perception that “effort is rewarded” does not carry the same meaning for primary and secondary students. This measurement heterogeneity is theoretically consistent with developmental accounts in which cumulative schooling experience progressively reshapes how students interpret meritocratic signals (Tang et al., 2025), and it calls for stage-sensitive item formulations in future work rather than treating the current scale as directly comparable across levels. Taken together, a parsimonious yet longitudinally invariant multidimensional instrument offers a stronger foundation for developmental research and for assessing how distinct facets of school meritocracy relate to inequality legitimation and other distributive outcomes.
More broadly, these findings sharpen how the literature should interpret meritocracy effects in educational contexts. When measures conflate perceptions with preferences or collapse merit and non-merit into a single continuum, they can blur substantively different belief profiles and, in turn, yield ambiguous conclusions about whether meritocracy is high, low, or declining (Reynolds & Xian, 2014; Zhu, 2025). Our results suggest that part of what is often interpreted as change in “belief in meritocracy” may reflect shifting recognition of non-meritocratic constraints rather than a straightforward decline in merit endorsement—an interpretation consistent with recent education-focused accounts of dual consciousness (C. Liu & Wang, 2025; Tang et al., 2025). Relatedly, while typological and person-centered approaches have documented coexistence of apparently contrasting beliefs in educational settings (Kwon & Pandian, 2024; Zhu, 2025), the present study shows how that coexistence can be represented within a coherent measurement model that supports longitudinal inference. Finally, the combination of strict longitudinal invariance and cross-level non-invariance clarifies a key boundary condition: within-student comparisons over time are warranted, whereas comparisons across school stages must account for the fact that the meaning of perceived meritocracy shifts with educational experience.
Although this study draws on a single-country, non-probabilistic sample, its contributions carry implications beyond the Chilean case. Three findings are likely to travel across educational systems. First, the conceptual distinction between perceived and preferred meritocracy, and between meritocratic and non-meritocratic principles, reflects general cognitive and normative capacities that develop during adolescence regardless of national context; the four-factor structure should therefore replicate in other highly stratified systems. Second, the coexistence of merit endorsement and recognition of non-meritocratic advantage—the core pattern underlying dual consciousness—has been documented in China (C. Liu & Wang, 2025; Tang et al., 2025), the United States, Finland (Zhu, 2025), and Europe (Kwon & Pandian, 2024), suggesting it is not a Chilean peculiarity. Third, the logic of longitudinal invariance testing as a prerequisite for developmental inference is methodologically general and applies to any panel study of meritocratic beliefs. By contrast, the specific pattern of cross-cohort non-invariance —concentrated in perceived effort—may be more system-dependent: it likely reflects the particular intensity and timing of school-based sorting in Chile’s tracked and marketized system. Future research in countries with different tracking regimes and stratification profiles will help clarify which aspects of measurement equivalence are universal and which are conditioned by institutional features.
Despite its contributions, this study has limitations that point to clear avenues for future research. First, the scale is deliberately minimalist—two items per factor—which constrains both content coverage and measurement reliability, and limits the precision with which factor-level nuances can be interpreted. While this trade-off is appropriate for a parsimonious survey instrument that captures four central dimensions, it means that claims about subtle within-dimension differences should be treated cautiously. Future work should prioritize expanding and refining the item pool, for instance by adding at least one additional indicator per factor and testing whether richer item sets alter the invariance conclusions reported here. Future work could improve precision by expanding and refining the item pool (e.g., adding more items per dimension, improving wording). Second, with only two waves and two school levels, additional waves and broader age coverage are needed to better trace developmental trajectories and pinpoint when perceived meritocracy shifts. Third, cross-level non-invariance calls for differential item functioning analyses and refinement of perceived-meritocracy items (or stage-specific modules) to support comparability across educational stages. Fourth, future research should unpack heterogeneity within non-meritocratic principles (e.g., wealth versus connections). Finally, linking these dimensions to inequality-related attitudes and testing moderation by school contexts would clarify whether distinct facets of meritocratic belief have different consequences and under what conditions they contribute to inequality legitimation. Overall, by providing an empirically supported and longitudinally invariant multidimensional measure for adolescents, this study offers a more reliable foundation for studying how school-based meritocratic socialization shapes interpretations of fairness and inequality.
7 References
Allen, K. (2016). Top girls navigating austere times: Interrogating youth transitions since the “crisis.” Journal of Youth Studies, 19(6), 805–820. https://doi.org/10.1080/13676261.2015.1112885
Batruch, A., Jetten, J., Van de Werfhorst, H., Darnon, C., & Butera, F. (2022). Belief in School Meritocracy and the Legitimization of Social and Income Inequality. Social Psychological and Personality Science, 194855062211110. https://doi.org/10.1177/19485506221111017
Bell, D. (1972). On equality: I. Meritocracy and equality. The Public Interest, 29, 29–68.
Bernstein, B. (2005). Theoretical Studies Towards a Sociology of Language.
Bourdieu, P. (2007). El sentido práctico. Buenos Aires: Siglo Veintiuno Argentina.
Bourdieu, P., & Passeron, J. C. (1990). Reproduction in Education, Society and Culture (Second Edition). Sage Publications Ltd.
Brown, T. A. (2015). Confirmatory factor analysis for applied research (Second edition). New York London: The Guilford Press.
Castillo, J. C., Iturra, J., Maldonado, L., Atria, J., & Meneses, F. (2023). A Multidimensional Approach for Measuring Meritocratic Beliefs: Advantages, Limitations and Alternatives to the ISSP Social Inequality Survey. International Journal of Sociology, 53(6), 448–472. https://doi.org/10.1080/00207659.2023.2274712
Castillo, J. C., Laffert, A., Carrasco, K., & Iturra-Sanhueza, J. (2025). Perceptions of inequality and meritocracy: Their interplay in shaping preferences for market justice in Chile (2016–2023). Frontiers in Sociology, 10, 1634219. https://doi.org/10.3389/fsoc.2025.1634219
Castillo, J. C., Torres, A., Atria, J., & Maldonado, L. (2019). Meritocracia y desigualdad económica: Percepciones, preferencias e implicancias. Revista Internacional de Sociología, 77(1), 117. https://doi.org/10.3989/ris.2019.77.1.17.114
Chancel, L., Gómez-Carrera, R., Moshrif, R., & Piketty, T. (2025). World Inequality Report 2026. World Inequality Lab, wir2026.wid.world.
Chauvin, B., Rauscher, C., Saidah, B., & Louvet, E. (2026). School meritocracy: A multidimensional construct? Evidence from the development of a school meritocracy scale by exploratory and confirmatory bifactor modeling. Current Psychology, 45(5), 519. https://doi.org/10.1007/s12144-026-09134-1
Chen, F. F. (2007). Sensitivity of Goodness of Fit Indexes to Lack of Measurement Invariance. Structural Equation Modeling: A Multidisciplinary Journal, 14(3), 464–504. https://doi.org/10.1080/10705510701301834
Darnon, C., Wiederkehr, V., Dompnier, B., & Martinot, D. (2018). “Where there is a will, there is a way”: Belief in school meritocracy and the social-class achievement gap. British Journal of Social Psychology, 57(1), 250–262. https://doi.org/10.1111/bjso.12214
Davidov, E., Meuleman, B., Cieciuch, J., Schmidt, P., & Billiet, J. (2014). Measurement Equivalence in Cross-National Research. Annual Review of Sociology, 40(Volume 40, 2014), 55–75. https://doi.org/10.1146/annurev-soc-071913-043137
Day, M. V., & Fiske, S. T. (2017). Movin’ on Up? How Perceptions of Social Mobility Affect Our Willingness to Defend the System. Social Psychological and Personality Science, 8(3), 267–274. https://doi.org/10.1177/1948550616678454
Deng, Y., & Wang, F. (2025). It’s my fault, I should try harder! The narratives of self-made upward mobility sustain belief in meritocracy in low social mobility context. British Journal of Psychology, bjop.70015. https://doi.org/10.1111/bjop.70015
Duru-Bellat, M., & Tenret, E. (2012). Who’s for Meritocracy? Individual and Contextual Variations in the Faith. Comparative Education Review, 56(2), 223–247. https://doi.org/10.1086/661290
García-Sánchez, E., Willis, G. B., Rodríguez-Bailón, R., Palacio Sañudo, J., David Polo, J., & Rentería Pérez, E. (2018). Perceptions of Economic Inequality and Support for Redistribution: The role of Existential and Utopian Standards. Social Justice Research, 31(4), 335–354. https://doi.org/10.1007/s11211-018-0317-6
García-Sierra, A. (2023). The dark side of meritocratic beliefs: Is believing in meritocracy detrimental to individuals from low socioeconomic backgrounds? Social Justice Research, 36(4), 385–409. https://doi.org/10.1007/s11211-023-00413-x
Henry, P. J., & Saul, A. (2006). The Development of System Justification in the Developing World. Social Justice Research, 19(3), 365–378. https://doi.org/10.1007/s11211-006-0012-x
Heuer, J.-O., Lux, T., Mau, S., & Zimmermann, K. (2020). Legitimizing Inequality: The Moral Repertoires of Meritocracy in Four Countries. Comparative Sociology, 19(4-5), 542–584. https://doi.org/10.1163/15691330-BJA10017
Hoyt, C. L., Burnette, J. L., Billingsley, J., Becker, W., & Babij, A. D. (2023). Mindsets of poverty: Implications for redistributive policy support. Analyses of Social Issues and Public Policy, 23(3), 668–693. https://doi.org/10.1111/asap.12367
Imhoff, D., & Brussino, S. (2025). Nociones infantiles sobre desigualdad social: atravesamientos ideológicos y procesos de socialización política. Revista Latinoamericana de Ciencias Sociales, Niñez y Juventud, 13(2). https://doi.org/10.11600/1692715x.1329071114
Janmaat, J. G. (2013). Subjective Inequality: A Review of International Comparative Studies on People’s Views about Inequality. European Journal of Sociology, 54(3), 357–389. https://doi.org/10.1017/S0003975613000209
Jost, J. T., Banaji, M. R., & Nosek, B. A. (2004). A Decade of System Justification Theory: Accumulated Evidence of Conscious and Unconscious Bolstering of the Status Quo. Political Psychology, 25(6), 881–919. https://doi.org/10.1111/j.1467-9221.2004.00402.x
Kline, R. B. (2023). Principles and Practice of Structural Equation Modeling. Guilford Publications.
Kwon, R., & Pandian, R. K. (2024). Multidimensionality in merit attitudes: The role of hard work, skills, and social connections in Europe. Social Science Research, 122, 103056. https://doi.org/10.1016/j.ssresearch.2024.103056
Lampert, K. (2013). Meritocratic Education and Social Worthlessness. London: Palgrave Macmillan UK. https://doi.org/10.1057/9781137324894
Liu, C., & Wang, J. (2025). Does Education Legitimise Inequality? Comparative Analysis of Income Inequality, Education, and Meritocratic Beliefs. The British Journal of Sociology, 1468–4446.70029. https://doi.org/10.1111/1468-4446.70029
Liu, Y., Millsap, R. E., West, S. G., Tein, J.-Y., Tanaka, R., & Grimm, K. J. (2017). Testing measurement invariance in longitudinal data with ordered-categorical measures. Psychological Methods, 22(3), 486–506. https://doi.org/10.1037/met0000075
López-Roldán, P., & Fachelli, S. (Eds.). (2021). Towards a Comparative Analysis of Social Inequalities between Europe and Latin America. Cham: Springer International Publishing. https://doi.org/10.1007/978-3-030-48442-2
Madeira, A. F., Costa-Lopes, R., Dovidio, J. F., Freitas, G., & Mascarenhas, M. F. (2019). Primes and Consequences: A Systematic Review of Meritocracy in Intergroup Relations. Frontiers in Psychology, 10, 2007. https://doi.org/10.3389/fpsyg.2019.02007
McCoy, S. K., & Major, B. (2007). Priming meritocracy and the psychological justification of inequality. Journal of Experimental Social Psychology, 43(3), 341–351. https://doi.org/10.1016/j.jesp.2006.04.009
Mijs, J. (2016a). Stratified Failure: Educational Stratification and Students’ Attributions of Their Mathematics Performance in 24 Countries. Sociology of Education, 89(2), 137–153. https://doi.org/10.1177/0038040716636434
Mijs, J. (2016b). The Unfulfillable Promise of Meritocracy: Three Lessons and Their Implications for Justice in Education. Social Justice Research, 29(1), 14–34. https://doi.org/10.1007/s11211-014-0228-0
Mijs, J. (2021). The paradox of inequality: Income inequality and belief in meritocracy go hand in hand. Socio-Economic Review, 19(1), 7–35. https://doi.org/10.1093/ser/mwy051
Mijs, J. (2026). Visualizing Belief in Merit and Privilege, 1930 to 2020: Rejoinder. Socius: Sociological Research for a Dynamic World, 12, 23780231261426413. https://doi.org/10.1177/23780231261426413
Mijs, J., Daenekindt, S., De Koster, W., & Van Der Waal, J. (2022). Belief in Meritocracy Reexamined: Scrutinizing the Role of Subjective Social Mobility. Social Psychology Quarterly, 85(2), 131–141. https://doi.org/10.1177/01902725211063818
Olivos, F. (2021). Motivation, Legitimation, or Both? Reciprocal Effects of Parental Meritocratic Beliefs and Children’s Educational Performance in China. Social Psychology Quarterly, 84(2), 110–131. https://doi.org/10.1177/0190272520984730
Pañeda-Fernández, I., Kamphorst, J., Van De Rijt, A., & Battu, B. (2026). The relevance of meritocratic beliefs for redistributive preferences increases with income. Social Science Research, 134, 103294. https://doi.org/10.1016/j.ssresearch.2025.103294
Putnick, D. L., & Bornstein, M. H. (2016). Measurement invariance conventions and reporting: The state of the art and future directions for psychological research. Developmental Review, 41, 71–90. https://doi.org/10.1016/j.dr.2016.06.004
Resh, N., & Sabbagh, C. (2014). Sense of justice in school and civic attitudes. Social Psychology of Education, 17(1), 51–72. https://doi.org/10.1007/s11218-013-9240-8
Reynolds, J., & Xian, H. (2014). Perceptions of meritocracy in the land of opportunity. Research in Social Stratification and Mobility, 36, 121–137. https://doi.org/10.1016/j.rssm.2014.03.001
Sandel, M. J. (2020). The tyranny of merit: What’s become of the common good? (First edition). New York: Farrar, Straus and Giroux.
Santander Ramírez, E., Berríos, L., Soto de la Cruz, P., & Avendaño Cassasa, M. (2020). Preferencias parentales de socialización valórica en el Chile contemporáneo, cómo influyen la clase social y la religión de los padres en la manera en que quieren criar a sus hijos? Apuntes: Revista de Ciencias Sociales, 47(87), 65–86. https://doi.org/10.21678/apuntes.87.1027
Sigelman, C. K. (2013). Age Differences in Perceptions of Rich and Poor People: Is It Skill or Luck? Social Development, 22(1), 1–18. https://doi.org/10.1111/sode.12000
Svetina, D., Rutkowski, L., & Rutkowski, D. (2020). Multiple-Group Invariance with Categorical Outcomes Using Updated Guidelines: An Illustration Using M plus and the lavaan/semTools Packages. Structural Equation Modeling: A Multidisciplinary Journal, 27(1), 111–130. https://doi.org/10.1080/10705511.2019.1602776
Tang, M., Li, A., & Wu, X. (2025). Meritocratic Myth in Mind? Socioeconomic Backgrounds and Shifting Beliefs about Meritocracy among College Students in China. Sociology of Education, 00380407251360432. https://doi.org/10.1177/00380407251360432
Tejero-Peregrina, L., Willis, G., Sánchez-Rodríguez, Á., & Rodríguez-Bailón, R. (2025). From Perceived Economic Inequality to Support for Redistribution: The Role of Meritocracy Perception. International Review of Social Psychology, 38(1), 4. https://doi.org/10.5334/irsp.1013
Traini, C. (2022). The stratification of education systems and social background inequality of educational opportunity. International Journal of Comparative Sociology, 63(1-2), 10–29. https://doi.org/10.1177/00207152211033015
Traini, C., Ehmes, S., & Gangl, M. (2025). Climbing the ladder or falling behind: How social mobility shapes perceptions of meritocracy in the wake of rising inequality. PO- LAR Working Paper #7. Frankfurt: Goethe University. Retrieved from Www.polar-Project.org, Version Dated 12 September 2025.
Van De Schoot, R., Lugtig, P., & Hox, J. (2012). A checklist for testing measurement invariance. European Journal of Developmental Psychology, 9(4), 486–492. https://doi.org/10.1080/17405629.2012.686740
Van De Schoot, R., Schmidt, P., De Beuckelaer, A., Lek, K., & Zondervan-Zwijnenburg, M. (2015). Editorial: Measurement Invariance. Frontiers in Psychology, 6. https://doi.org/10.3389/fpsyg.2015.01064
Van De Werfhorst, H. G. (2024). Is Meritocracy Not So Bad After All? Educational Expansion and Intergenerational Mobility in 40 Countries. American Sociological Review, 89(6), 1181–1213. https://doi.org/10.1177/00031224241292352
Wiederkehr, V., Bonnot, V., Krauth-Gruber, S., & Darnon, C. (2015). Belief in school meritocracy as a system-justifying tool for low status students. Frontiers in Psychology, 6.
Wiesner, T., & Sachweh, P. (2026). Effort versus Advantage: Visualizing (Relative) Belief in Meritocracy, 1930 to 2022—A Comment on Mijs (2018), 12. https://doi.org/10.1177/23780231261425841
Wu, H., & Estabrook, R. (2016). Identification of Confirmatory Factor Analysis Models of Different Levels of Invariance for Ordered Categorical Outcomes. Psychometrika, 81(4), 1014–1045. https://doi.org/10.1007/s11336-016-9506-0
Young, M. (1958). The rise of the meritocracy. New Brunswick, N.J., U.S.A: Transaction Publishers.
Zhou, X. (2019). Equalization or Selection? Reassessing the “Meritocratic Power” of a College Degree in Intergenerational Income Mobility. American Sociological Review, 84(3), 459–485. https://doi.org/10.1177/0003122419844992
Zhu, L. (2025). Meritocratic beliefs in the United States, Finland, and China: A multidimensional approach using latent class analysis. The British Journal of Sociology, 76(1), 153–172. https://doi.org/10.1111/1468-4446.13152
Footnotes
The survey was collected within the research project “Meritocracy in schools: Moral foundations of the education market and its implications for civic education in Chile” (FONDECYT Regular 2021 Nº 1210847).↩︎
Table 2 totals (N = 1,508) correspond to the sum of person-wave observations (846 at T1 + 662 at T2), rather than unique individuals.↩︎